Edit chart
Loading graph
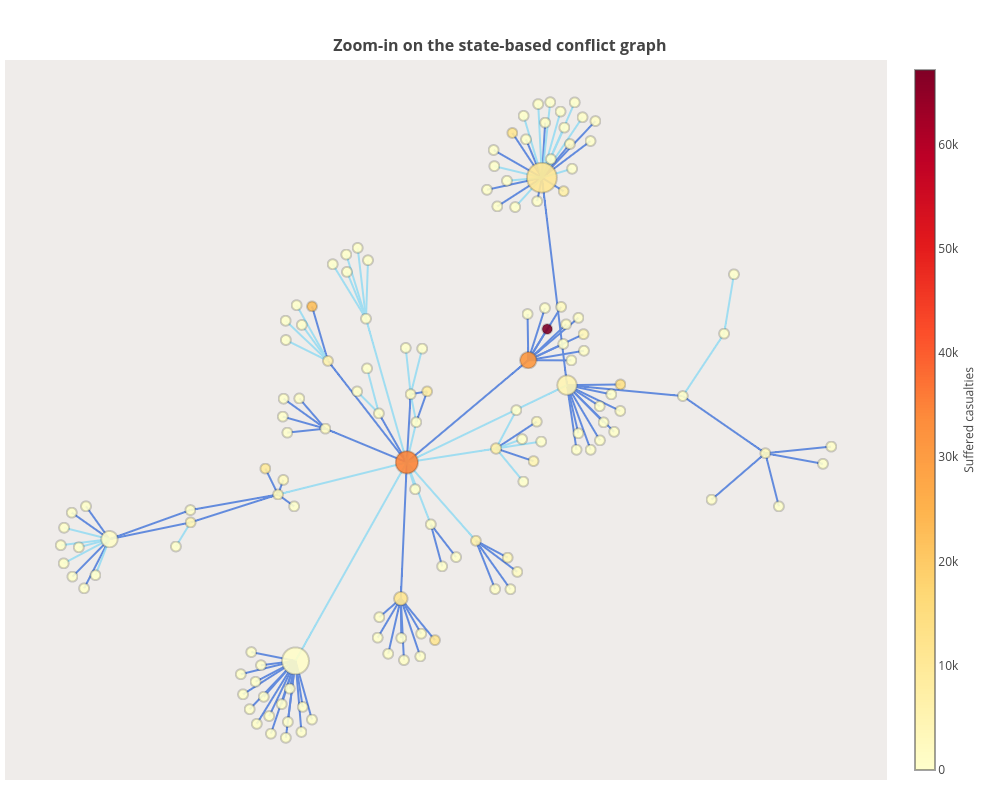
Vikjan94's interactive graph and data of "Zoom-in on the state-based conflict graph" is a line chart. The x-axis shows values from -0.5541818280160361 to 1.0522741487768779. The y-axis shows values from -0.4400095422606367 to 0.597454161535554.